Writing unit tests is a thing we do at Aftonbladet, and our front end JavaScript is no exception. We are currently using GruntJS to (amongst other things) run our Jasmine specs / unit tests in PhantomJS as part of our development workflow.
We also tend to use the Intellij IDEA IDE from JetBrains.
I have been having a not-so-great time refactoring a piece of JS code recently, breaking existing unit tests in ways I didn’t expect. When working on backend code (Java, or whatever) I’d just run the failing test in my IDE using the debugger to inspect the running code. The process for debugging javascript/jasmine unit tests have been less straightforward, in part due to our somewhat complicated GruntJS setup. Ideally, I wanted to simply run the debugger from inside my IDE at the click of a button, rather than having to go through a set of manual steps and switching from my IDE context. Here’s what I did:
1. Make sure NodeJS and Grunt were properly installed and configured
2. Install the NodeJS plugin for IDEA
3. Get the JetBrains IDE support browser extension from the chrome web store.
4. Set up a grunt-jasmine task (I also set up a jasmine task, “mytarget”, but that is optional) to generate a _SpecRunner.html template. Adding the :build flag/option to the grunt-jasmine task will have it generate a SpecRunner file rather than running the tests.
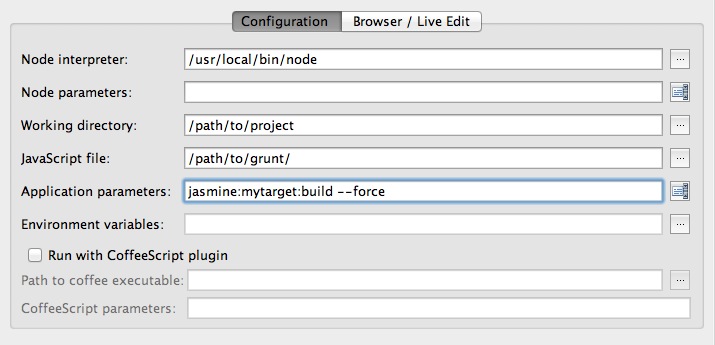
5. Create a new Node Run/Debug configuration in IntelliJ, indicating the project directory as Working directory, the path to the GruntJS install as JavaScript file and the test-task (“jasmine:mytarget:build” in my case) in the Application parameters field. It is also possible to add the –filter -flag as an application parameter, to generate a SpecRunner that only runs a subset of the specs.
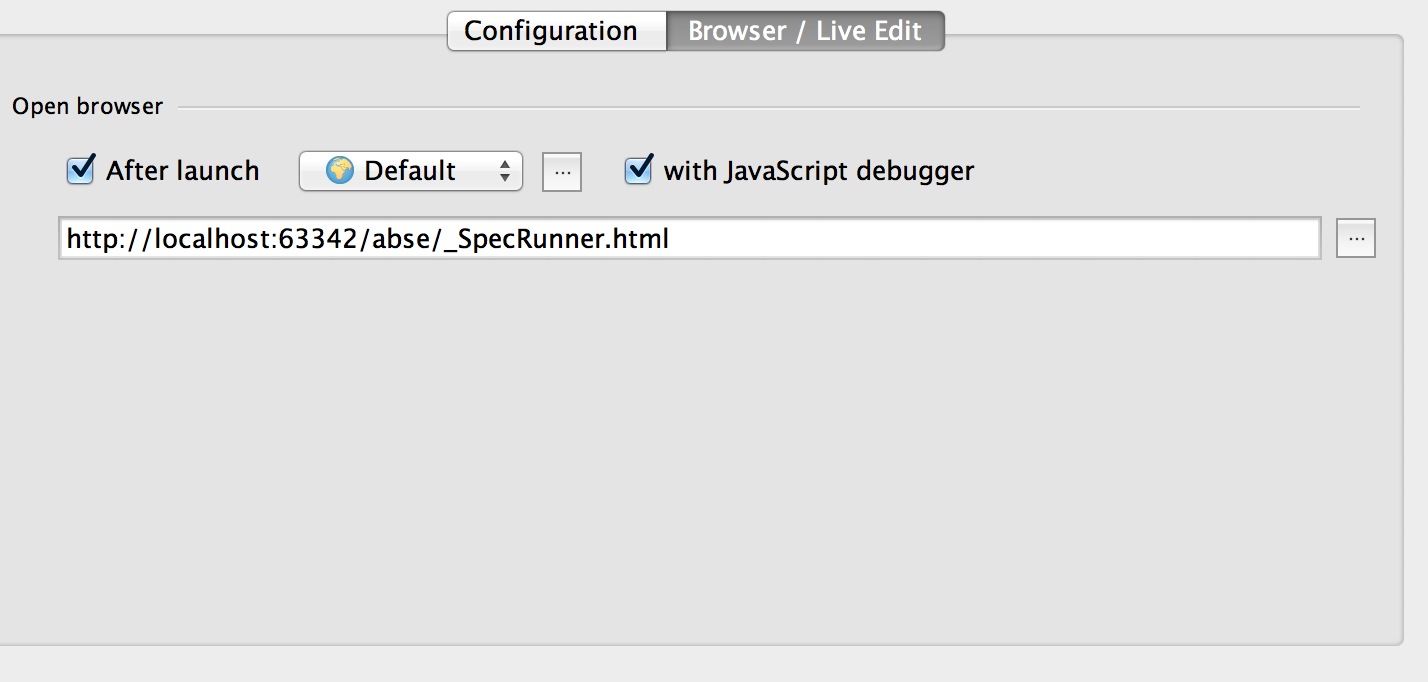
6. Enable the option to launch the Chrome browser with the IDE debugger when the grunt task is done, opening the _SpecRunner.html file.
.
7. Set breakpoints in javascript or spec files, and run/debug the new configuration config.
I realize it should be possible to connect the IntelliJ debugger to the Node/Grunt process instead of running the tests in a Chrome browser, but as it turned out to be surprisingly tricky for me to get the breakpoints to take effect this Chrome-based solution solved my problem with a lot less fiddling around.